May 2021 Report of the Multiple Cycles Indicator
May 28th, 2021
Fourier analysis is coupled with GARCH regression, mixed distribution estimation, and harmonic regression to detect the multiple cycle structures for 25 OECD member countries. Out-of-sample estimates indicate the current direction of economic growth. The current report is based on OECD figures up until 2021 Q1.
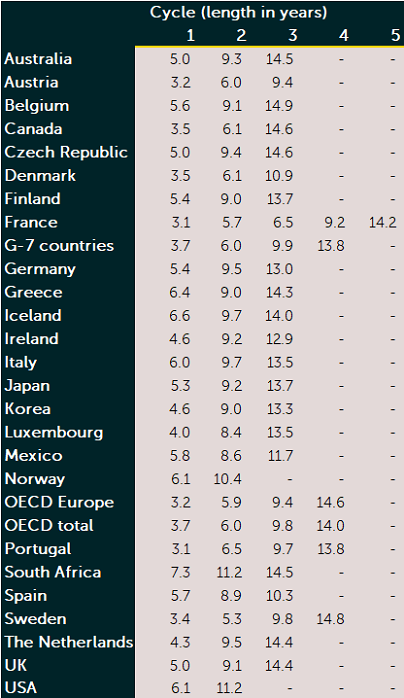
Table 1 presents an overview of the detected cycle lengths for all 25 member countries, the G-7 countries, Europe and the entire OECD. Multiple cycle structures are found for all 25 member countries. There are 2 countries with 2 cycles, 20 countries with 3 cycles, and 5 countries with 4 cycles and 1 country with 5 cycles. Interestingly, some cycle lengths occur more frequently than others. The cycles of 5-6 years, and the cycles of 9-10 years occur more frequently than the other cycles, with 14 and 18 occurrences respectively.
Table 1. Detected cycle lengths
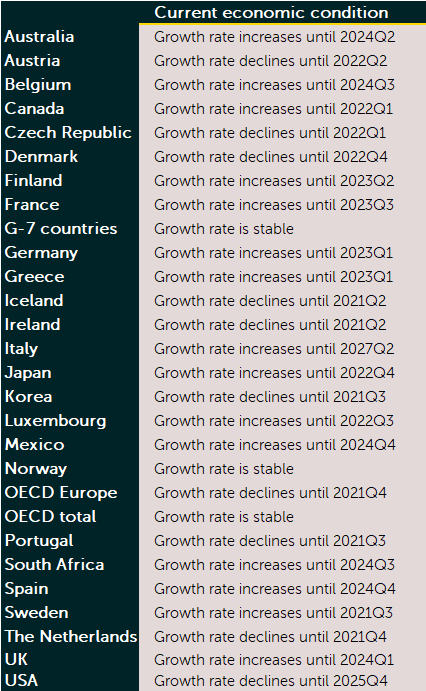
We use the detected cycles length in Table 1 to model the cyclic behavior of the GDP growth rates. We employ a trend-cycle model, where the cycles are captured using harmonic terms. Table 2 presents the estimated out-of-sample direction of economic activity. The MCI indicates an upward trend in the year 2021 for 15 of the 25 OECD member countries in the sample. For these countries, the GDP growth rate is expected to increase for several quarters in a row. GDP growth is expected to decline for 9 of the 25 OECD member countries. GDP growth is expected to be stable for the G-7 countries and the entire OECD, and to decline for Europe.
Table 2. Current economic condition
The figures below show the GDP growth rates and out-of-sample fit for the G-7 countries, Europe, and the entire OECD. The MCI initially indicates a relatively stable period, or a continued decline for Europe. However, in 2022 there is a turning point, and economic recovery starts. The harmonic regression model is represented by the yellow line.
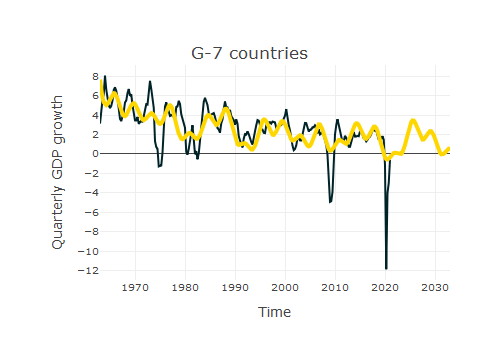
Figure 1. Quarterly GDP growth and harmonic fit for G-7 countries
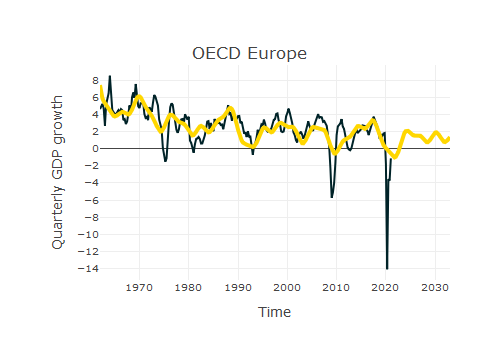
Figure 2. Quarterly GDP growth and harmonic fit for Europe
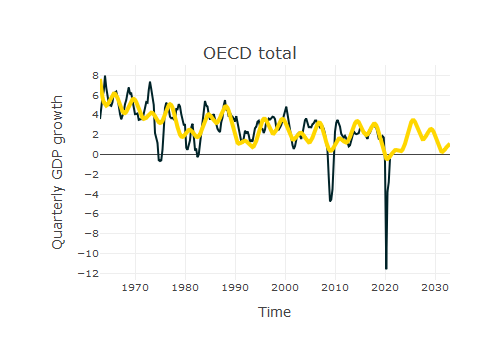
Figure 3. Quarterly GDP growth and harmonic fit for the entire OECD
Additionally, we provide the harmonic regression fits for all panel member countries, the G-7 countries, Europe and the entire OECD:
![]() Harmonic regression fit May 2021 [Adobe PDF]
Harmonic regression fit May 2021 [Adobe PDF]
