May 2020 Report of the Multiple Cycles Indicator
May 28th, 2020
Fourier analysis is coupled with GARCH regression, mixed distribution estimation, and harmonic regression to detect the multiple cycle structures for 25 OECD member countries. Out-of-sample estimates indicate the current direction of economic growth. The current report is based on OECD figures up until 2020 Q1.
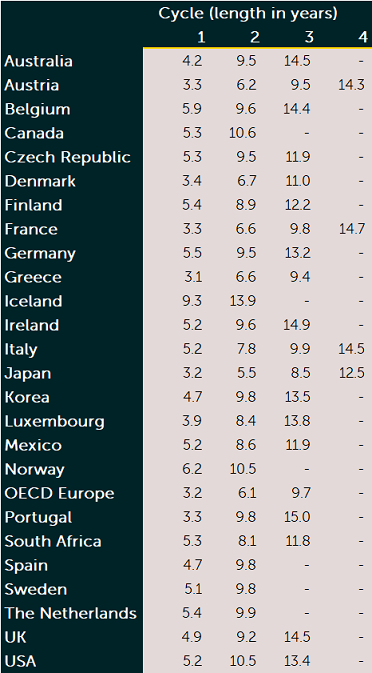
Table 1 presents an overview of the detected cycle lengths for all 25 member countries, and Europe. Multiple cycle structures are found for all 25 member countries. There are 6 countries with 2 cycles, 16 countries with 3 cycles, and 4 countries with 4 cycles. Interestingly, some cycle lengths occur more frequently than others. The cycles of 5-6 years, and the cycles of 9-10 years occur more frequently than the other cycles, with 13 and 17 occurrences respectively.
Table 1. Detected cycle lengths
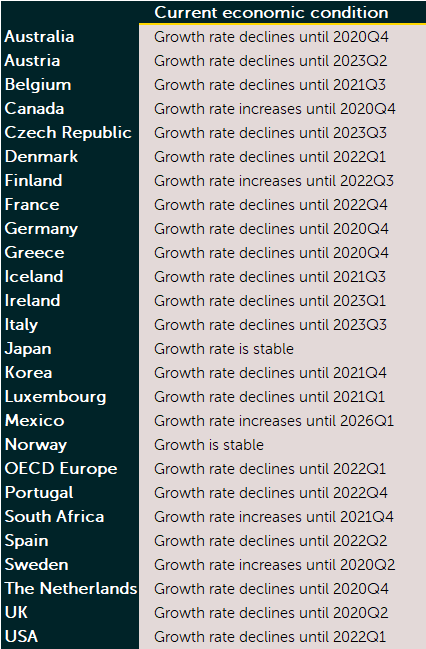
We use the detected cycles length in Table 1 to model the cyclic behavior of the GDP growth rates. We employ a trend-cycle model, where the cycles are captured using harmonic terms. Table 2 presents the estimated out-of-sample direction of economic activity. The MCI indicates a downward trend in the year 2020 for 18 of the 25 OECD member countries in the sample. For these countries, the GDP growth rate is expected to decline until at least 2020Q4. The outlook is stable for Japan and Norway. GDP growth is expected to increase for Canada, Finland, Mexico, South Africa, and Sweden.
Table 2. Current economic condition
The figures below show the GDP growth rates and out-of-sample fit for Sweden, Italy, and Spain. For Scandinavian countries the economic outlook is positive, however, in the case of Sweden, economic activity is expected to decrease from 2020Q3. Italy and Spain were also highlighted in the February 2020 outlook because of the expected declined in economic growth. The actuals reveal that this decline has started in the first quarter of 2020. The model indicates a continued low level of economic growth, or even a further decline, for a substantial period of time. The harmonic regression model is represented by the yellow line.
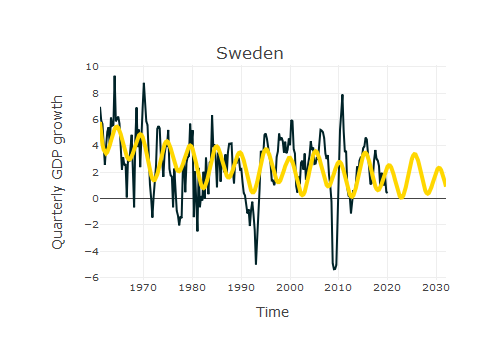
Figure 1. Quarterly GDP growth and harmonic fit for Sweden
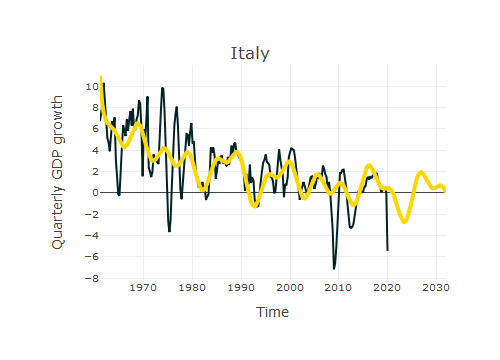
Figure 2. Quarterly GDP growth and harmonic fit for Italy
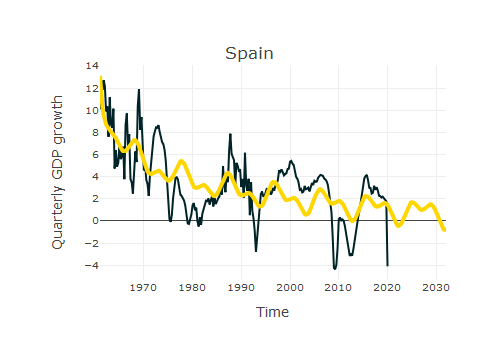
Figure 3. Quarterly GDP growth and harmonic fit for Spain
Additionally, we provide the harmonic regression fits for all panel member countries, and Europe:
![]() Harmonic regression fit May 2020 [Adobe PDF]
Harmonic regression fit May 2020 [Adobe PDF]
