August 2020 Report of the Multiple Cycles Indicator
August 30th, 2020
Fourier analysis is coupled with GARCH regression, mixed distribution estimation, and harmonic regression to detect the multiple cycle structures for 25 OECD member countries. Out-of-sample estimates indicate the current direction of economic growth. The current report is based on OECD figures up until 2020 Q2.
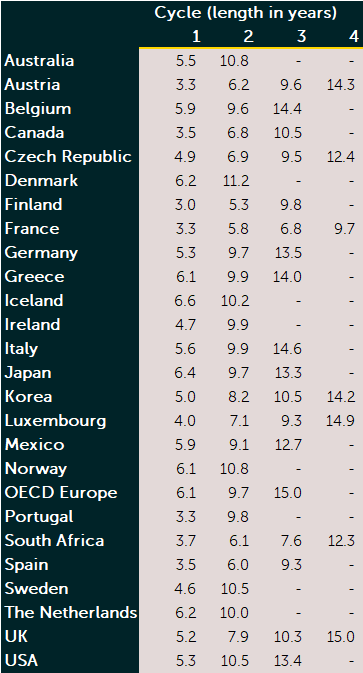
Table 1 presents an overview of the detected cycle lengths for all 25 member countries, and Europe. Multiple cycle structures are found for all 25 member countries. There are 8 countries with 2 cycles, 11 countries with 3 cycles, and 7 countries with 4 cycles. Interestingly, some cycle lengths occur more frequently than others. The cycles of 5-7 years, and the cycles of 9-10 years occur more frequently than the other cycles, with 23 and 16 occurrences respectively.
Table 1. Detected cycle lengths
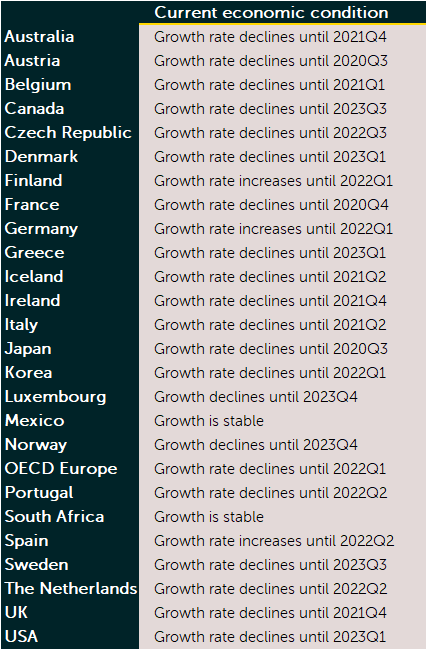
We use the detected cycles length in Table 1 to model the cyclic behavior of the GDP growth rates. We employ a trend-cycle model, where the cycles are captured using harmonic terms. Table 2 presents the estimated out-of-sample direction of economic activity. The MCI indicates a downward trend in the year 2020 for 20 of the 25 OECD member countries in the sample. For these countries, the GDP growth rate is expected to decline until at least 2020Q3. The outlook is stable for Mexico and South Africa. GDP growth is expected to increase for Finland, Germany, and Spain.
Table 2. Current economic condition
The figures below show the GDP growth rates and out-of-sample fit for Finland, Germany and Spain. The only three countries for which the MCI indicates an increase in the GPD Growth rate. Although the most recent quarter shows excessive negative growth rates, the outlook for these three countries is positive. According to the MCI, we might expect a relatively quick recovery for these countries. The harmonic regression model is represented by the yellow line.
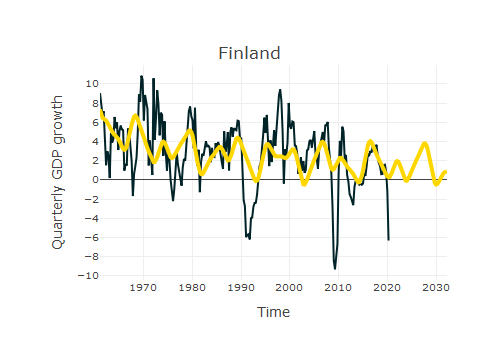
Figure 1. Quarterly GDP growth and harmonic fit for Finland
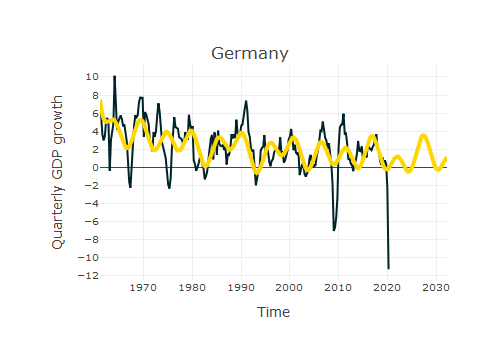
Figure 2. Quarterly GDP growth and harmonic fit for Germany
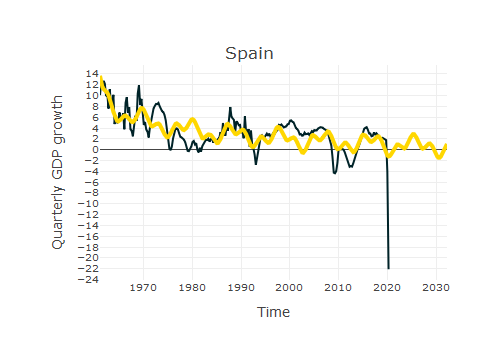
Figure 3. Quarterly GDP growth and harmonic fit for Spain
Additionally, we provide the harmonic regression fits for all panel member countries, and Europe:
![]() Harmonic regression fit August 2020 [Adobe PDF]
Harmonic regression fit August 2020 [Adobe PDF]
