February 2020 Report of the Multiple Cycles Indicator
February 21st, 2020
Fourier analysis is coupled with GARCH regression, mixed distribution estimation, and harmonic regression to detect the multiple cycle structures for 25 OECD member countries. Out-of-sample estimates indicate the current direction of economic growth. The current report is based on OECD figures up until 2019 Q4.
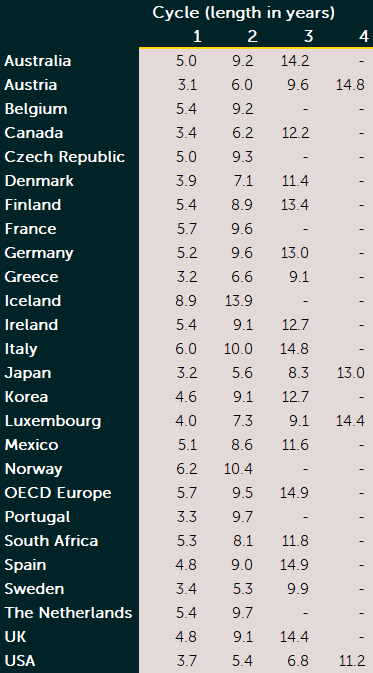
Table 1 presents an overview of the detected cycle lengths for all 25 member countries, and Europe. Multiple cycle structures are found for all 25 member countries. There are 7 countries with 2 cycles, 15 countries with 3 cycles, and 4 countries with 4 cycles. Interestingly, some cycle lengths occur more frequently than others. The cycles of 5-6 years, and the cycles of 9-10 years occur more frequently than the other cycles, with 14 and 16 occurrences respectively.
Table 1. Detected cycle lengths
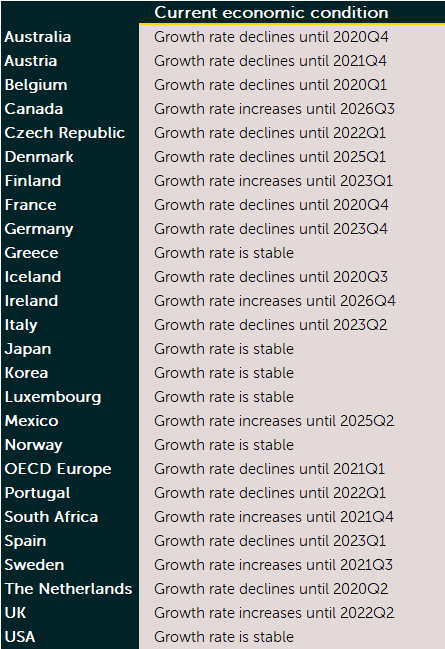
We use the detected cycle lengths in Table 1 to model the cyclic behavior of the GDP growth rates. We employ a trend-cycle model, where the cycles are captured using harmonic terms. Table 2 presents the estimated out-of-sample direction of economic activity. The MCI indicates a downward trend in the year 2020 for 12 of the 25 OECD member countries in the sample. This concerns Western and Southern European countries, and Australia, where the GDP growth rate is expected to decline until the second half 2020, or later. The outlook is stable for Luxembourg, Greece, Korea, and Japan. GDP growth is expected to remain stable, or even increase, for Northern America, the UK, the Scandinavian countries, and South Africa.
Table 2. Current economic condition
The figures below show the GDP growth rates and out-of-sample fit for three Southern European countries: Italy, Portugal, and Spain. For these countries, the harmonic regression model indicates a longer period of GDP growth rate decline, until at least 2022Q1. The harmonic regression model is represented by the yellow line.
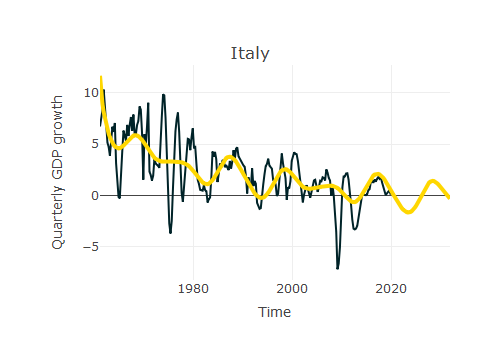
Figure 1. Quarterly GDP growth and harmonic fit for Italy
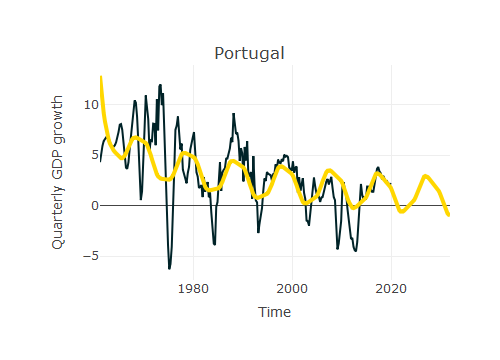
Figure 2. Quarterly GDP growth and harmonic fit for Portugal
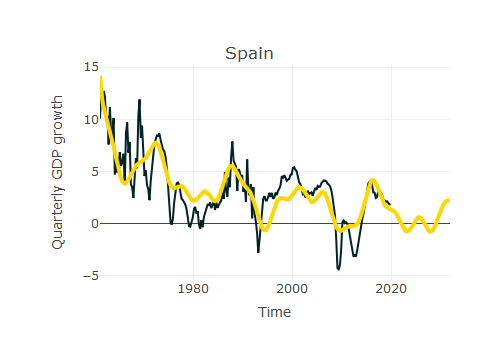
Figure 3. Quarterly GDP growth and harmonic fit for Spain
Additionally, we provide the harmonic regression fits for all panel member countries, and Europe:
![]() Harmonic regression fit February 2020 [Adobe PDF]
Harmonic regression fit February 2020 [Adobe PDF]
